The purpose of the portal is to monitor and control devices. These are its core element.
This section is by far the most extensive of this manual and it tries to cover all the different aspects when dealing with Nethix’s devices and other devices that are able to communicate with the portal.
6.1. Registration
Before configuring any device in the portal, they must be registered using their serial number that is a unique 14 characters alphanumeric string (see 13.3. System information).
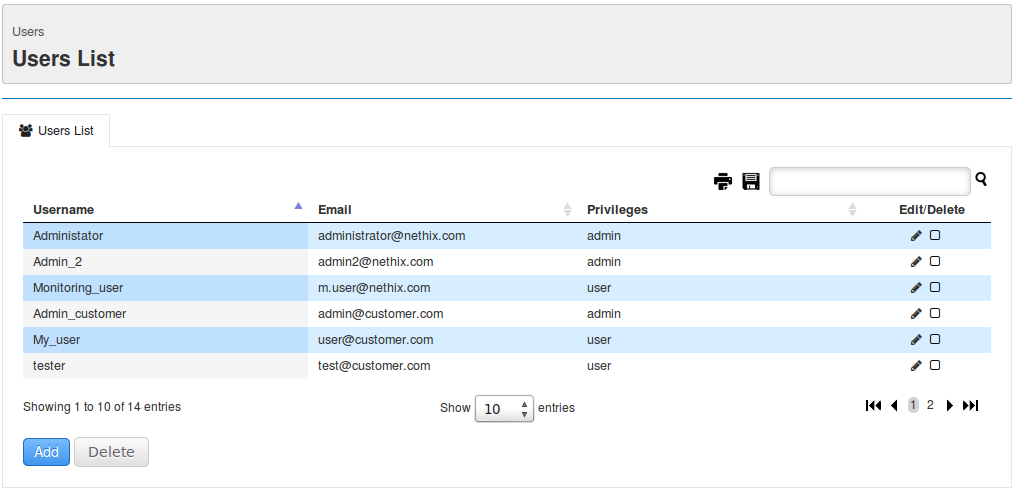
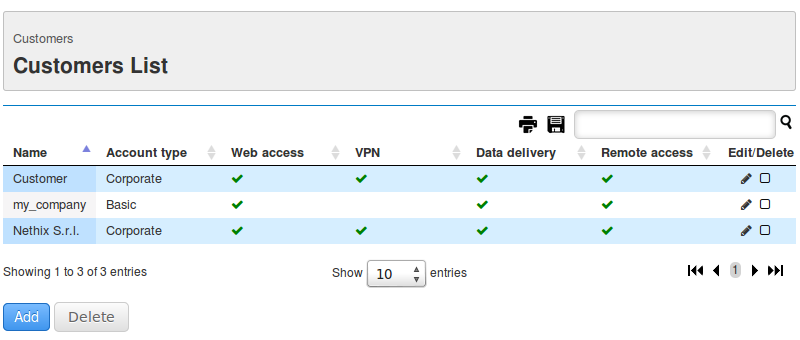
All the serial numbers are visible in the Devices List that is accessible only by the system or administrator users.
Each row in this list refers to the serial number of one and only one device, the device’s name, the name of the customer to which is associated and the device model. The last three parameters are displayed only if the device has already been configured.
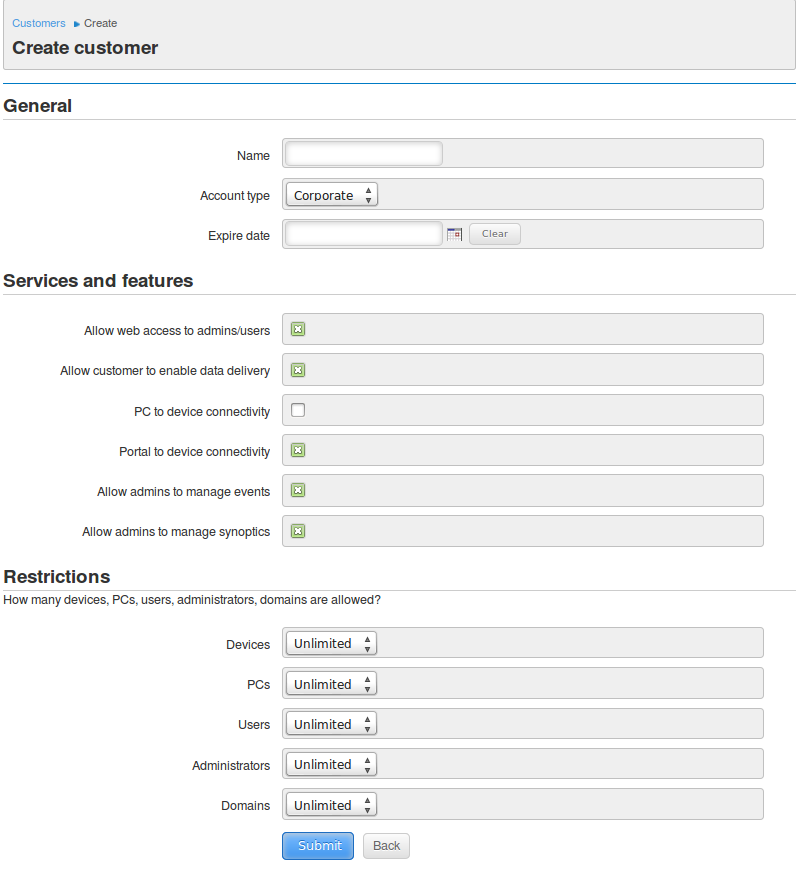
In this area it is possible to register or edit a device by clicking on the Add button whilst he/she can edit a device by clicking on the Edit icon in the device row.
Both options, register and edit devices, allow to set the following options:
- Serial number - The serial number of the device that is unique and it’s used for identifying the device inside the portal.
- Model - The device model. It cannot be modified when editing the device.
- Software version - Current version installed on the device.
- Customer - Indicates to which customer this serial number belongs to.
- Characteristics - A list of selectable features based on the device capabilities. According to the these features, some functionalities will be enabled in the portal for each device.
In order to avoid security issues, only the system user can register/edit/remove serial numbers.
Once a device’s serial number is registered, the Portal will be ready for configuring the device.
6.2. Device management
This section explains how to monitor and control devices, how to manage PCs/laptops for connecting to the devices, how to control several devices simultaneously and how to display the monitored data in a user-friendly format.
6.2.1. Devices
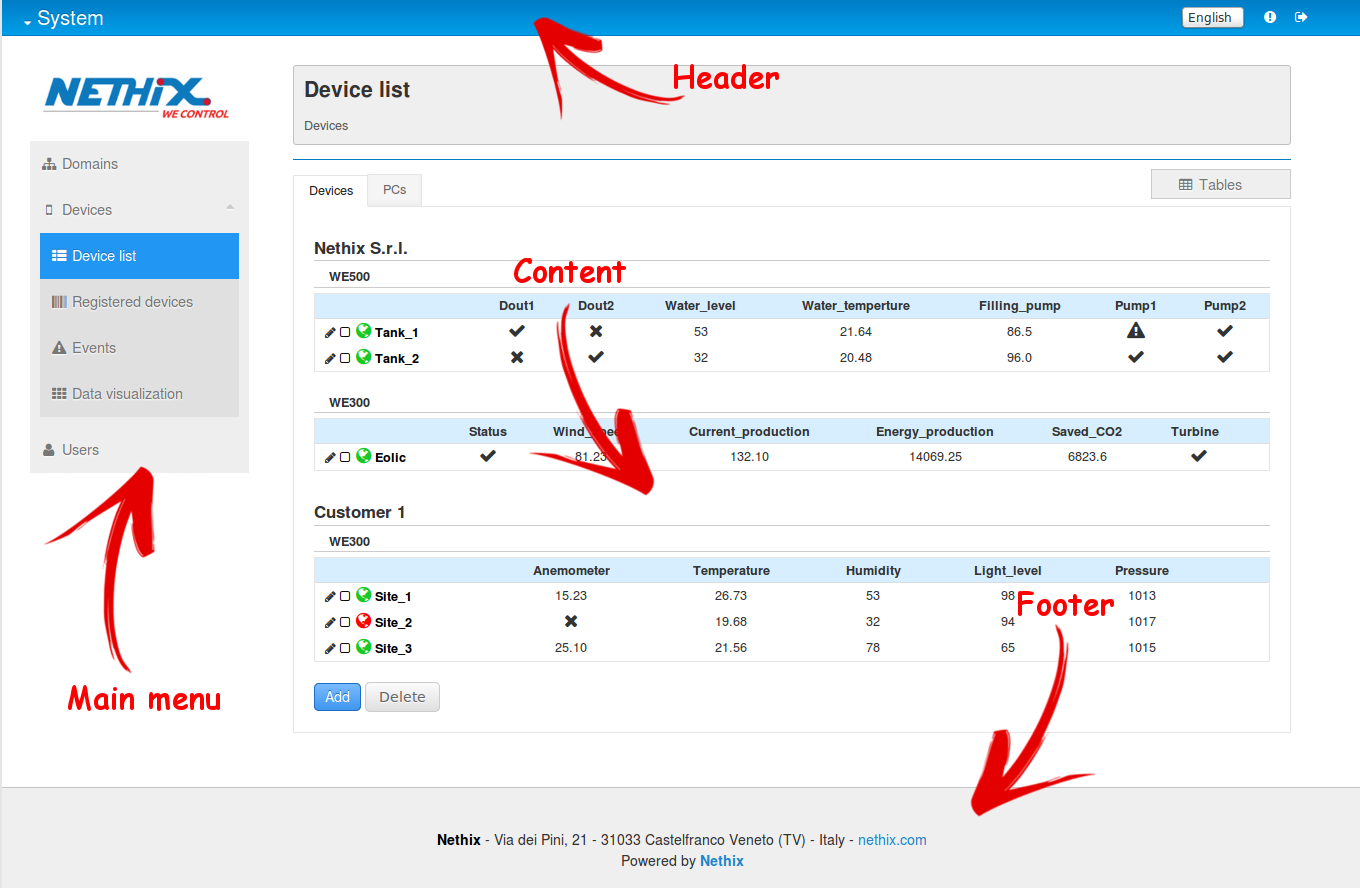
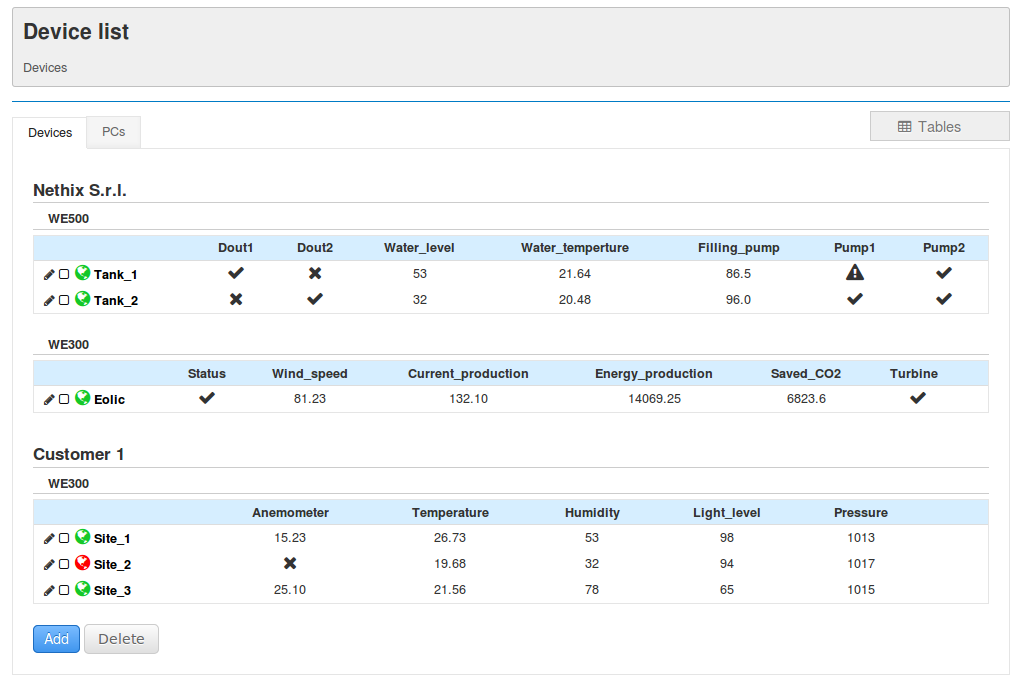
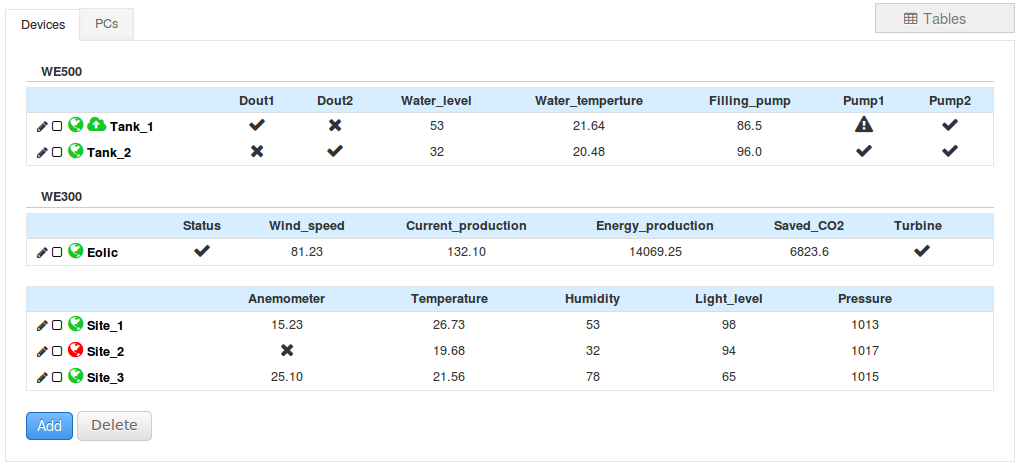
The Devices List shows all the devices grouped by type with their data. By clicking on device row, the device monitoring and control section is displayed.
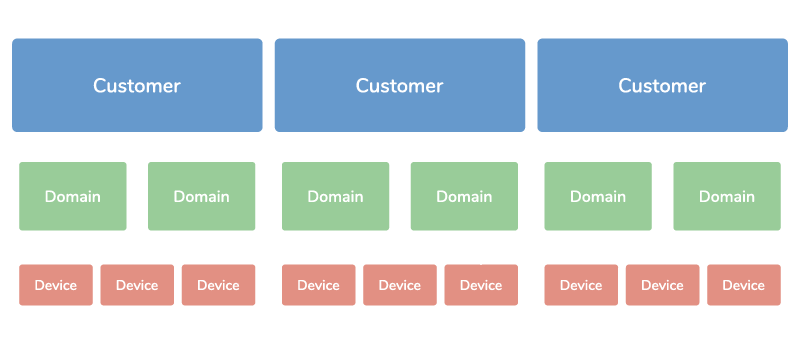
The system user will see the devices grouped by type and by customer.
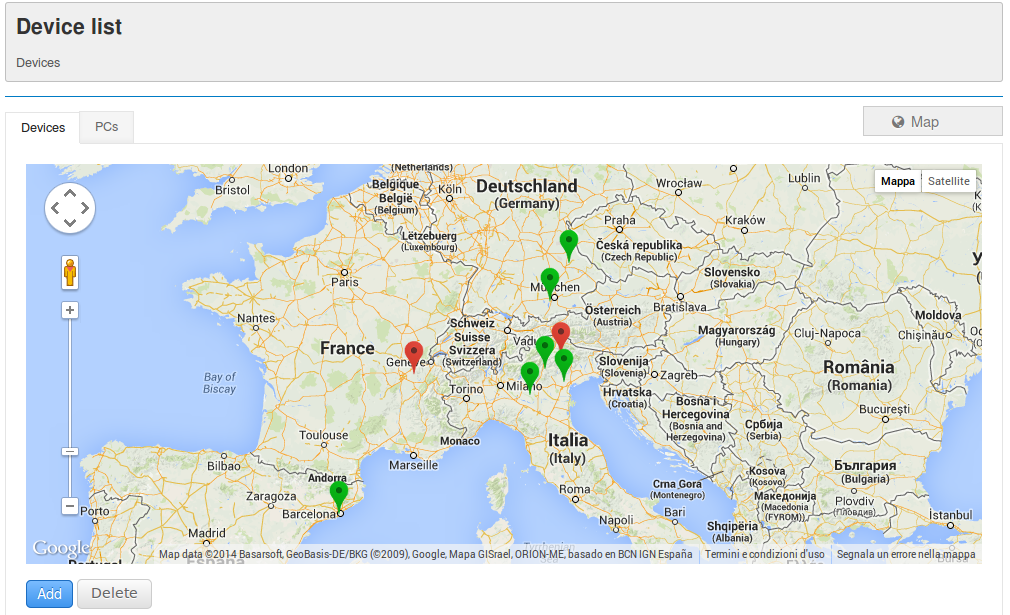
The devices list can be visualized in two modalities: As a table that is the default behavior and as a map in which the latitude and longitude indicates the geographical position of the device.
The following image shows the table visualization:
The following image shows the map visualization:
In the table visualization, each device is displayed as in the following image and can show up to two icons:

The first icon indicates if the device is:
| Icon |
Meaning |
|---|

|
On-line |

|
Off-line |

|
Not configured for remote access or VPN |
The second icon indicates that:
| Icon |
Meaning |
|---|

|
There is at least one event associated and it has not been triggered |

|
There is at least one event associated and it has been triggered |
The data of each device is the set of variables sent by the devices to the portal. The selection of each variable takes place in the device itself. In the case of the WE500 and similar devices the option Data delivery must be enabled.
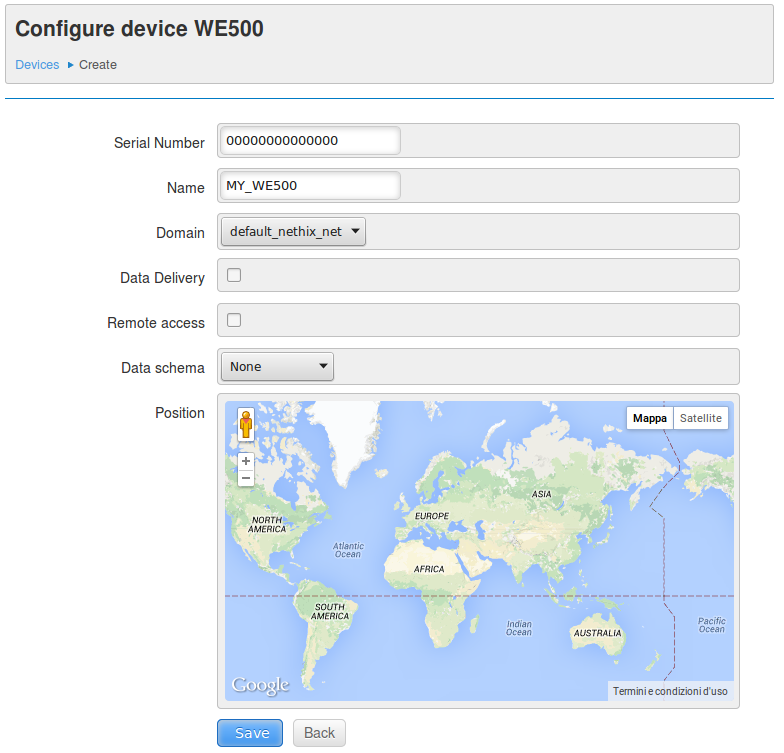
A system or administrator user can create a device by clicking on the Add button whilst he/she can edit a device by clicking on the Edit icon in the device row.
Both options, create and edit devices, allow to set the following options:
- Serial number - The serial number of the device that is unique and it’s used for identifying the device inside the portal.
- Name - A unique human-readable name that identifies the device.
- Domain - The domain to which this device belongs to.
- Data delivery - Allow the device to send data to the portal.
- Remote access - Allow the portal to access the device for control and configuration operations.
- Data visualization - The schema used for visualizing the device data. Data schema are explained in their respective section.
- Position - Set the geographic position of the device.
Deleting devices is a simple task that can be done directly in the Devices List by selecting the check box of the desired device(s) and clicking on the Delete button.
6.2.2. PC/Laptops
A user can register PCs and laptops in the portal for creating a direct communication channel to the devices. This channel is established through a dedicated Virtual Private Network (VPN).
This functionality is optional and can be enabled by privileged users only.
The PCs List shows all the computers with their permissions.
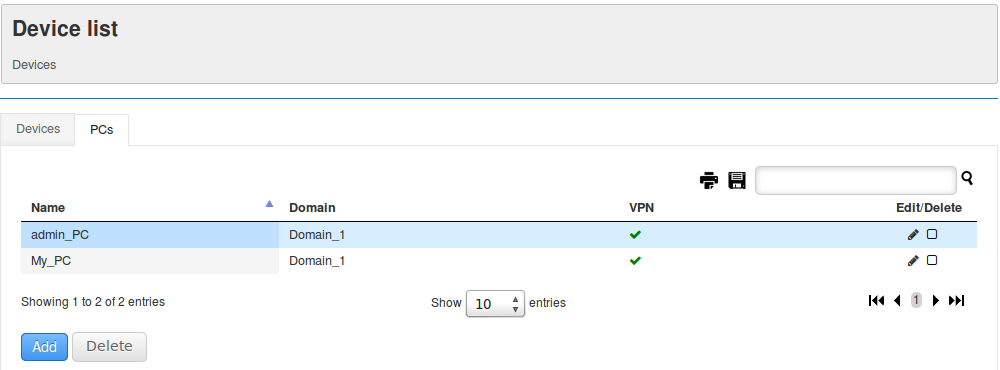
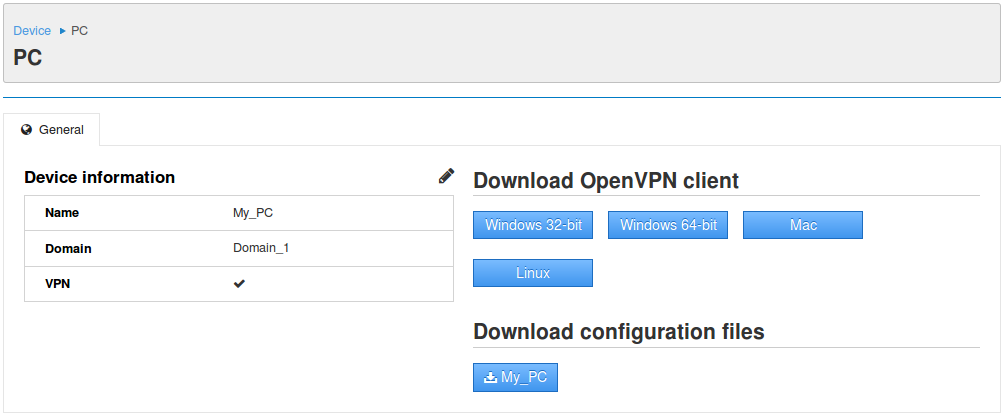
By clicking on a row, some basic information regarding the PC is displayed along with the download options and instructions for installing the VPN client in their PC.
Installing the VPN client and the configuration files is described in the VPN manual.
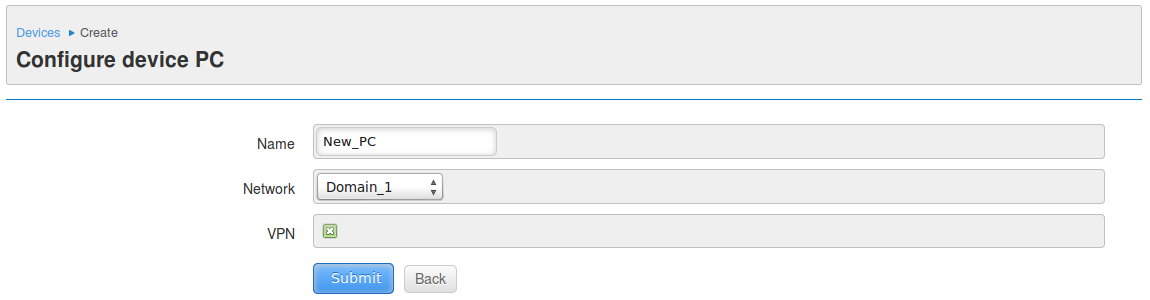
A system or administrator user can add a PC by clicking on the Add button whilst he/she can edit a PC by clicking on the Edit icon in the PC row.
Both options, create and edit PCs, allow to set the following options:
- Name - A unique name that identifies the PC.
- Domain - The domain to which this PC belongs to.
- VPN - Enable the use of the VPN.
Deleting PCs is a simple task that can be done directly in the PCs List by selecting the check box of the desired PC(s) and clicking on the Delete button.
6.3 Device monitoring and control
By clicking on the Devices List that shows all the devices grouped by type the row of a device, the user can access its monitoring and control functionalities.
This page contains several tabs with specific functionalities that are described in the following sections.
6.3.1 General
The General tab in the Devices → Monitoring menu contains three areas.
The first area at the top left contains a table with basic device information. The device information may vary according to the model and its permissions.
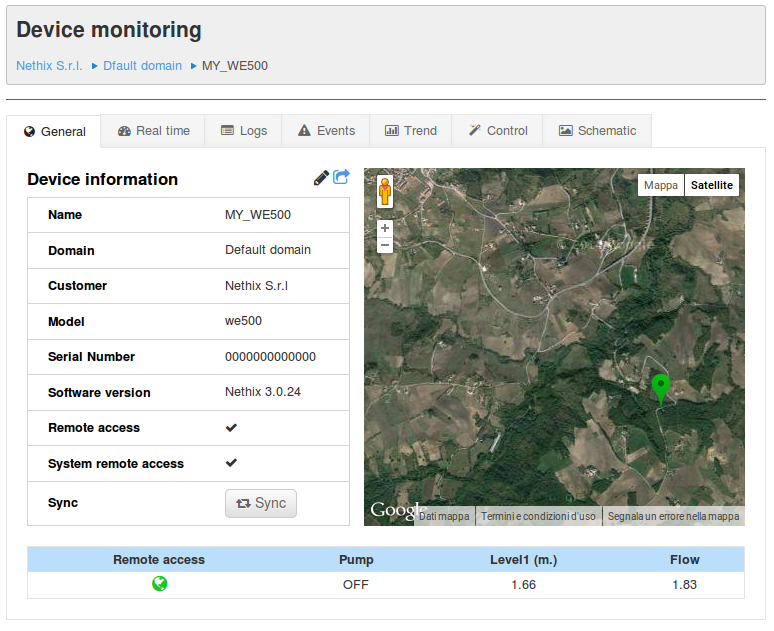
The parameters shown are:
- Name - Device name.
- Domain - Domain to which the device belongs to.
- Model - Device model. Eg. WE500.
- Serial number - Device serial number.
- Data delivery - Shows if the device has the permissions to send data to the portal.
- Remote access/VPN - Shows if the portal has the permissions to control the device.
- Sync button - This button appears only when the device is on-line.
It’s used by the portal to have permissions to control the device.
Eg. The portal synchronizes to the device before turning-on a pump. This step is needed for avoiding that other unauthorized systems can communicate to the devices.
Next to the Device information title, there can be up to three icons:
| Icon |
Meaning |
|---|

|
Edit the device. It’s the same as clicking the Edit button
in the Devices List |
|
|
If the device is associated to connectivity events, the icon will be
green if any event has not been triggered, it will be red if any event
has been triggered. No icon is displayed if there are no events associated |

|
Connect directly to the device web interface. This icon is present only
if the VPN is configured and the device is on-line |
The second area contains a map that shows the device geographical position.
The third area at the bottom shows the real-time data summary of the device. This information is important since it shows the current values of the most important variables in the remote system.
The variables that are displayed in this area, their quantity and how they are displayed is defined in the Summary Schema that is explained in its corresponding section.
If the real-time data is not displayed, there could be a connectivity problem or simply that the device is not configured for sending data to the portal. In the former case, the displayed message will be in red, in the later case it will be yellow since is not an error, only a warning.
6.3.2 Real-time
The Real-time tab in the Devices → Monitoring menu shows the list of variables and their values in real-time.
This is a uniques characteristic of the Nethix Portal since from this area is not only possible to monitor the value of each variable, but to change it in real-time assuming the user has the proper permissions.
In the top right of this area, it is possible to select the refresh period. The user can select how often in seconds or minutes the Portal will send request to the device for gathering the variables’ values.
Clicking on a variable will show a pop-up that allows to set its value. This operation is allowed only if the variable has been configured as write-only or read-write and if the user has the proper permissions.
If the variable is associated to an event in the device and the value that is set is within the range of the event, the Portal will visualize the variable in red as shown above. When the variable changes value and leaves the event condition, the Portal will hide the alarm condition.
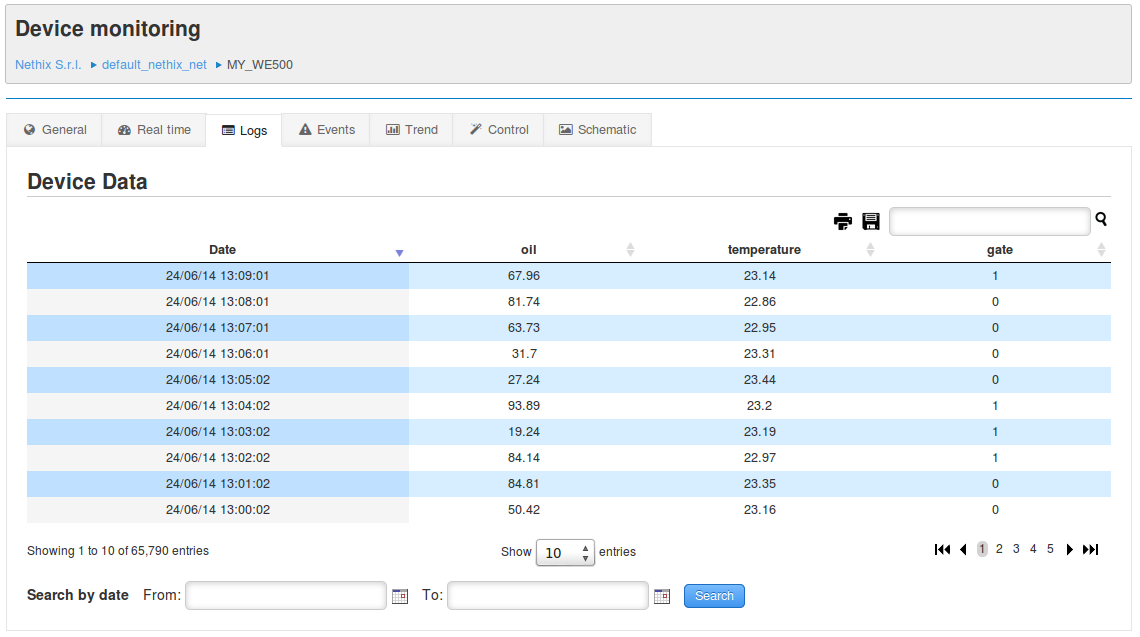
6.3.3 Logs
The Data tab in the Devices → Monitoring menu shows all the data that the devices sends to the portal. Each device can send a completely different set of variables with respect to other device, even if the device models are the same. The frequency for sending the data to the portal is configured in the device. The portal only receives the data and stores it in database.
By default, the data will be displayed in chronological order starting with the most recent data. However, using the powerful tables filtering capabilities, the data can be displayed in ascending or descending order, it can be searched by date/time ranges, it can be searched by any desired string, plus other features such as pagination and number of results per page.
The variables that are displayed in this area, their appearance order and how they are displayed is defined in the 6.5 Data visualization menu.
The data can also be printed or exported in CSV, XLS and PDF formats.
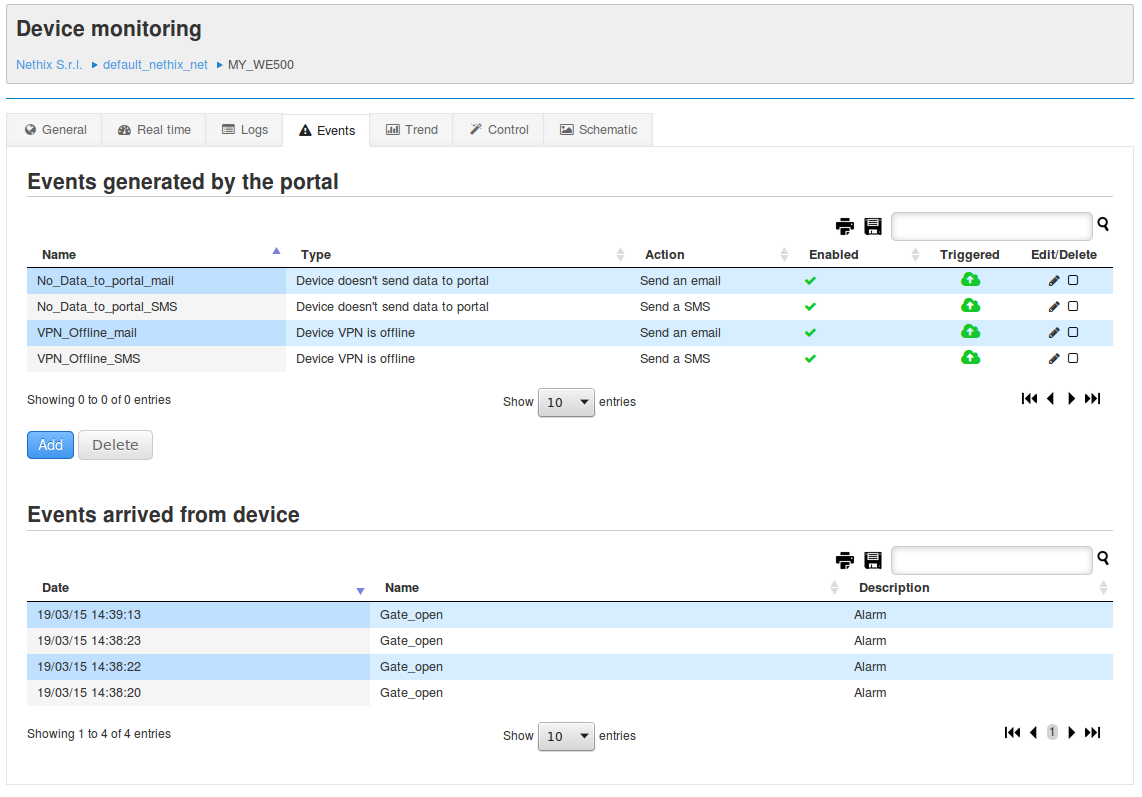
6.3.4 Events
The Events tab in the Devices → Monitoring menu shows if there is a connectivity event configured for this device and its status.
This is not a log of events, it only indicates if there is an event status.
The table shows the following fixed columns:
- Name - Event name.
- Type - Type of event. Currently there are two types of events:
- When the device does not send data to portal
- When the VPN is off-line
- Action - Action to be executed when the event is triggered.
- Enable - Indicates, through an icon, if the event is enabled or disabled for this specific device.
- Triggered - Indicates, through an icon, if the event has been triggered for this specific device.
- Edit/Delete - Edit or delete the event.
As with all the tables in the portal, it can be searched by any desired string, it provides pagination and number of results per page among other features.
The data can also be printed or exported in CSV, XLS and PDF formats.
The events management where the devices can be associated to the events is explained in the Events section.
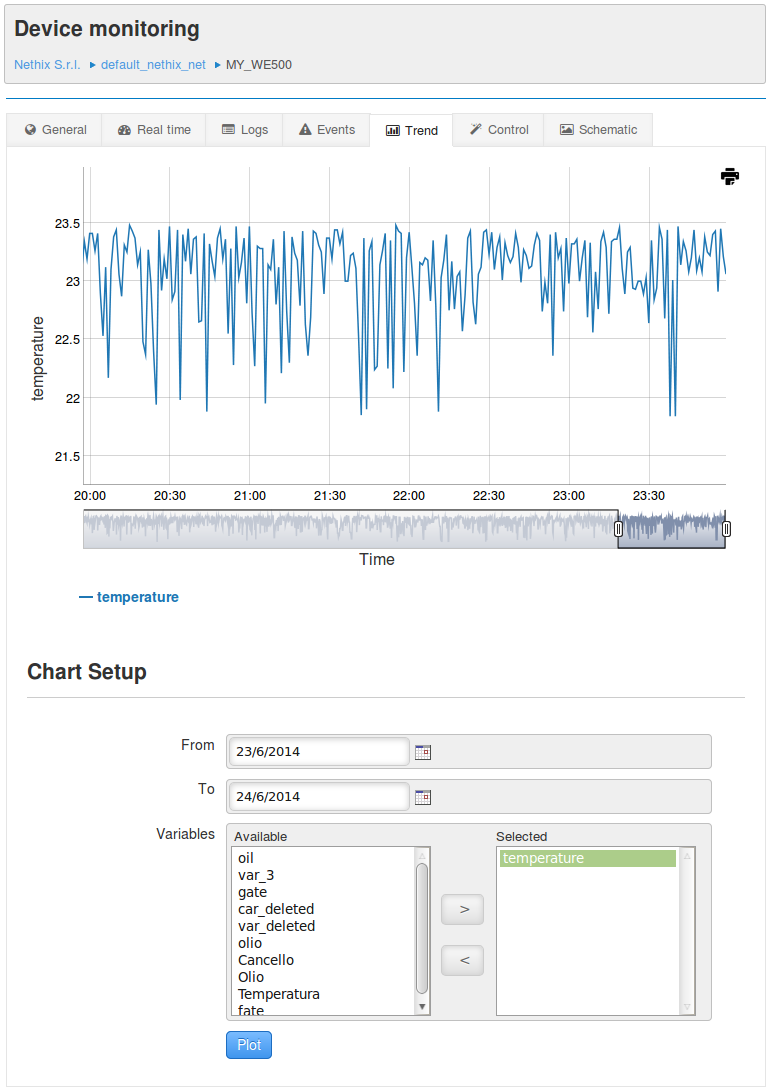
6.3.5 Trend
The Trend tab in the Devices → Monitoring menu shows a multi-trace chart in which an unlimited number of variables from a date/time range can be plotted and printed.
By default, when the user enters in this tab, a chart with the last 24 hours of one variable will be displayed, later the user can select the variables and define the date/time range to be charted.
The chart shows the values of the selected variables (Y-axis) during a time frame (X-axis). The zoom bar below the plot allow to analyze with greater detail any given plot, specially when it has many points and several traces.
The two slide bars at the limits of the zoom bar can be adjusted for increasing/decreasing the zoom. After moving the slide bars and by clicking between them and holding the button pressed, the zoomed area can be moved along the plot.
Double clicking between the slide bars resets the zoom and the plot returns to its original dimensions.
6.3.6 Control
The Control tab in the Devices → Monitoring menu allows to set the value of a variable in real-time.
Controlling the device in real-time is one of the unique characteristics of this portal since most other services try to accomplish this complex task by polling or other non-reliable procedures.
The mechanisms used by this portal together with the devices that support it, provides a reliable, secure and efficient method for communicating from the portal to the devices.
This functionality is available if the the device is configured for remote access and the device is on-line. Configuring the device for remote access is explained in the Devices Management Devices management section.
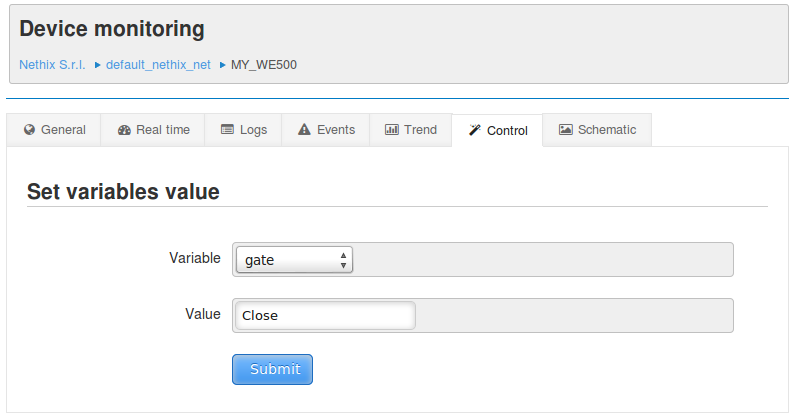
Notice that other control features will be added in the near future.
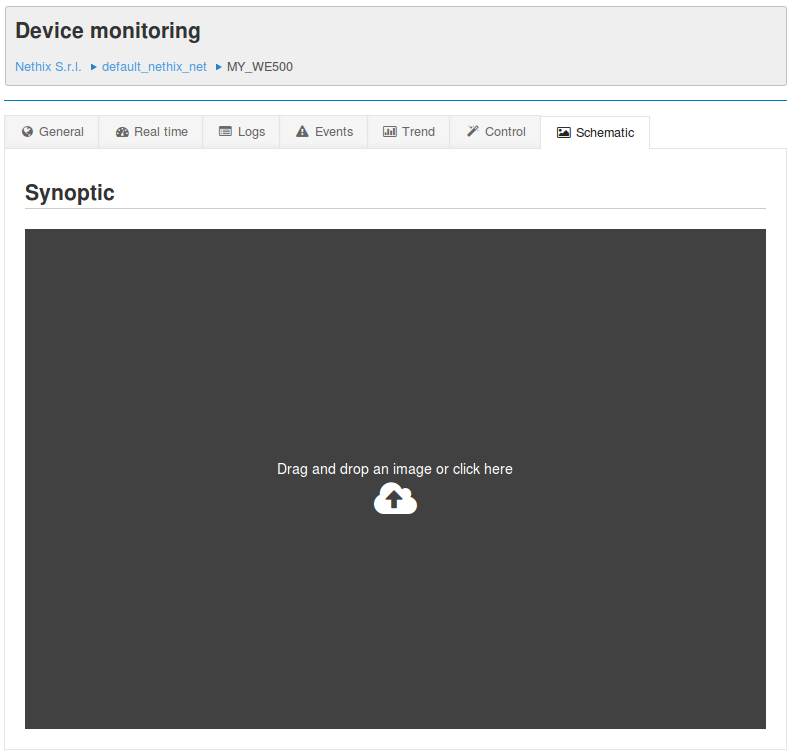
6.3.7 Schematic
The Schematic tab in the Devices → Monitoring menu allows a user to upload an image to which it can attach labels and icons for simulating the monitored system. This is one of the unique characteristics of this portal that allows to build a custom synoptic without the need to use external software, additional plug-ins or programming tools.
The image can have a maximum size of 500 x 718 pixels and it can be easy uploaded by a drag&drop operation and clicking the Save button.
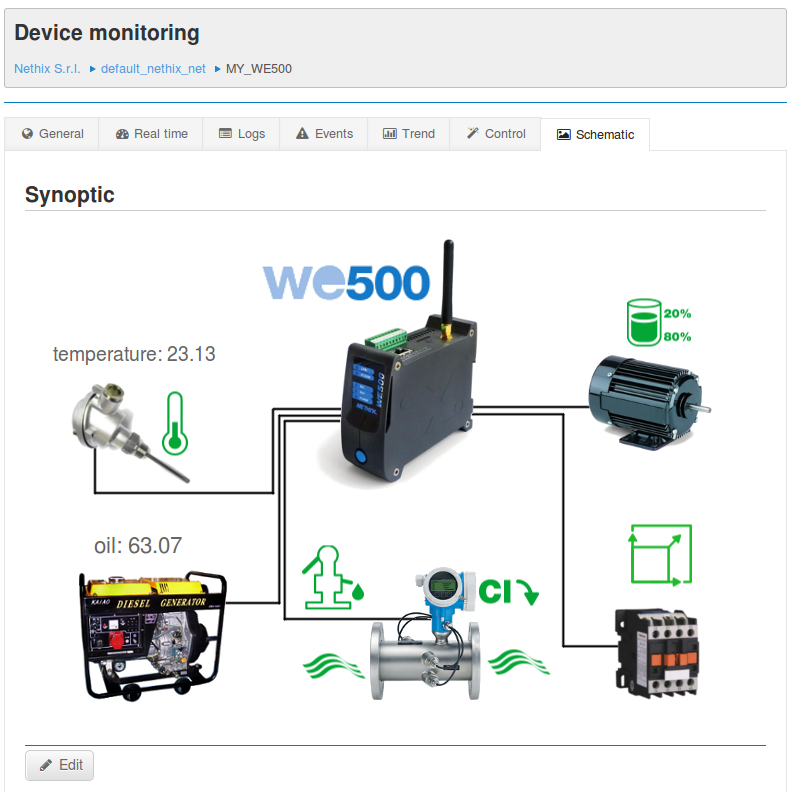
Once the image is uploaded, the variables can be added by clicking the Edit button that will display the variable setup menu with the following contents:
- Variable - Select one of the available variables.
- Visualization -
- Default - The raw value of the variables.
- Icon -
- Icons - Select one of the available icons.
- Condition - A comparison operator such as Greater than.
- Value - The value at which the chosen icon, when compared with the previous selected comparison operator, is true and thus it is shown in red. If the comparison is false, it is shown in green.
Other variables can be added by clicking on the Add variable button. If the variable is shown with the default visualizations, it is displayed inside red box that can be easily resized by clicking on the red box corners or moved by clicking onside the red box.
Removing a variable can be done by double clicking inside the red box.
After all the desired variables were added, the synoptic can be saved by clicking the Save button. All modification will be lost in this button is not used.
6.4 Events
In the portal, the events are directly related to the connectivity status of the devices.
Currently, there are two types of connectivity events:
- When the device does not send data to portal
- When the device’s VPN or remote access is off-line
There is an associated action to each event in the system. The action may be the delivery of an email or SMS to one or more emails or phone numbers with a user-defined text message.
Notice that the events regarding the variables that each device monitors, eg. the level in a water tank, depend directly from the device itself and not from the portal, therefore the actions of those events are triggered by and in the device.
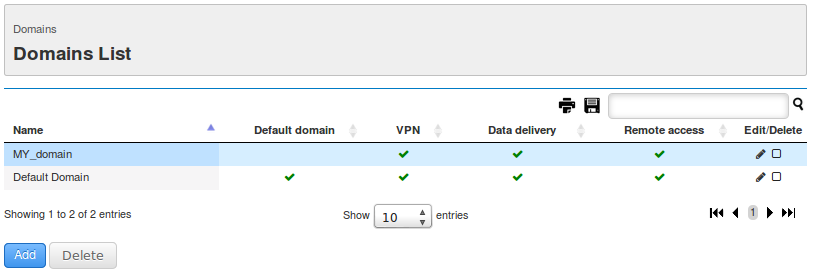
The Events List in the Devices → Events menu shows all the events for the current customer with their main characteristics.
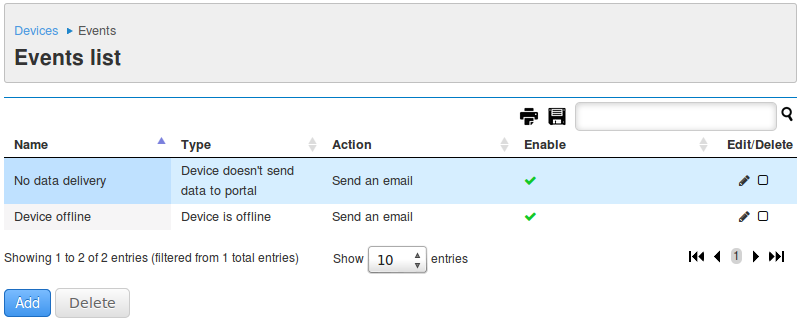
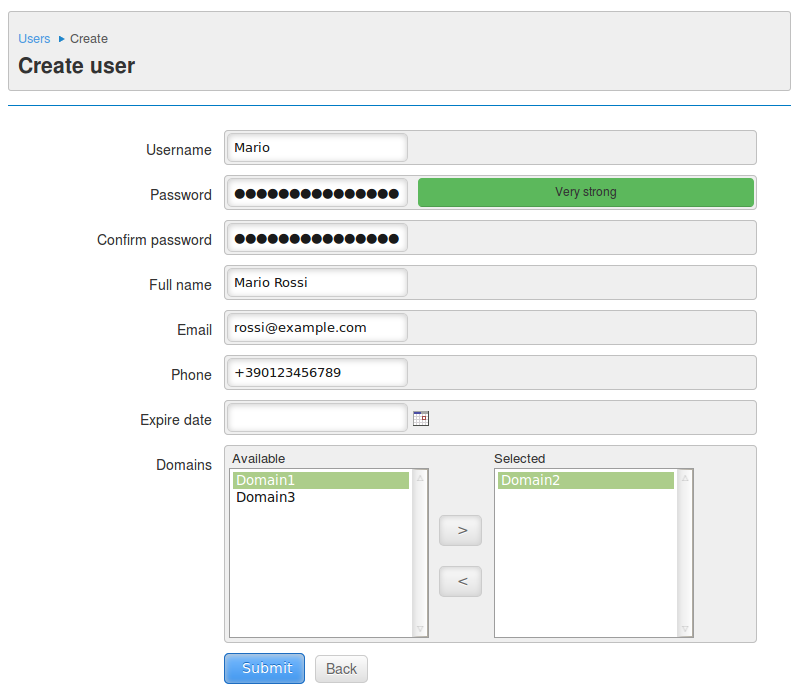
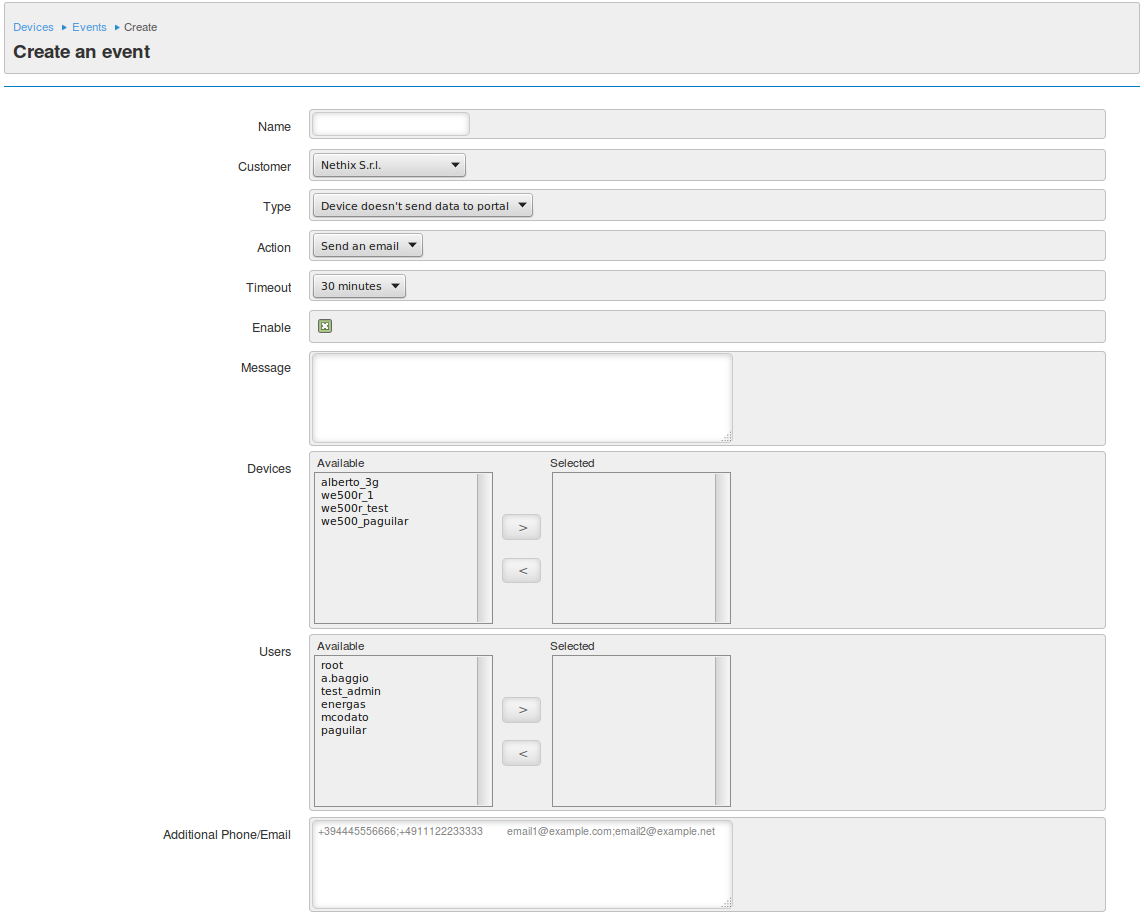
A system or administrator user can create an event by clicking on the Add button whilst he/she can edit an event by clicking on the Edit icon in the event row.
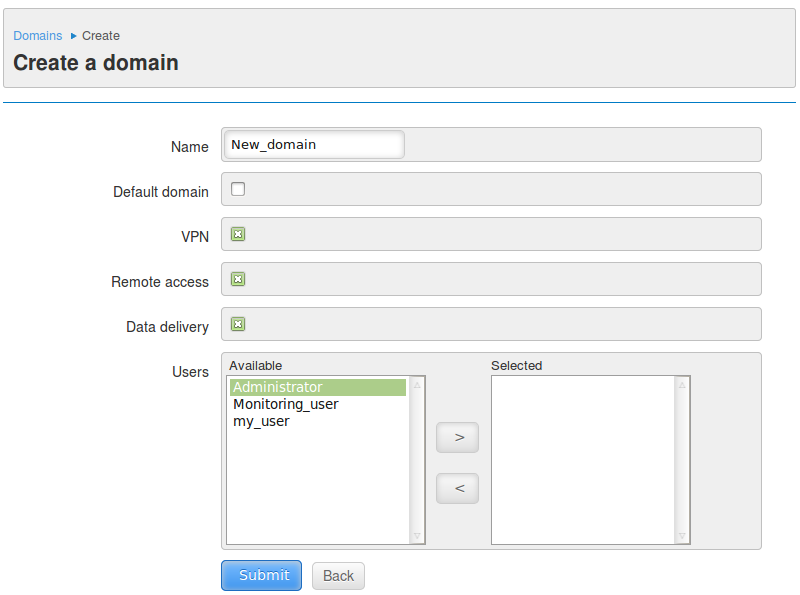
Both options, create and edit events, allow to set the following options:
- Name - Event name.
- Type - This is the condition that will be evaluated for deciding to trigger an action or not.
- Action - Action to trigger.
- Timeout - When the condition specified in the Type above is true, wait this timeout before triggering the action.
- Enable - Enable/Disable the event.
- Message - The text message to be sent.
- Devices - The devices that are associated to this event.
- Users - The registered users that will receive the SMS or emails.
- Additional Phone/Email - The phone number or emails that are not registered in the portal, but will receive the SMS or emails.
6.5 Data visualization
The Portal provides the possibility to display the value of the variables with a different visualization with respect to how they are displayed in the device.
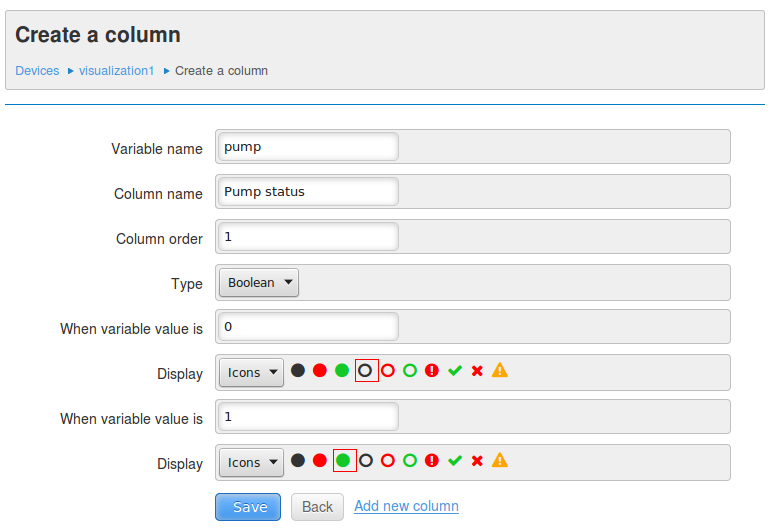
For example, for the Pump variable that can have the value 0 or 1, the user can decide to visualize the string OFF when the value is 0 and the string ON when the value is 1. It is also possible to display the value of a variable as an icon or even to hide it. All this can be done by using the so-called data visualizations.
A visualization is a set of rules that define how the value of a variable is displayed.
The graphical areas in which the data visualizations are used are:
- The Devices → Devices list page
- The real-time summary in the General tab inside the Devices → List of devices → Monitoring page
- The logs table in the Logs tab inside the Devices → List of devices → Monitoring page
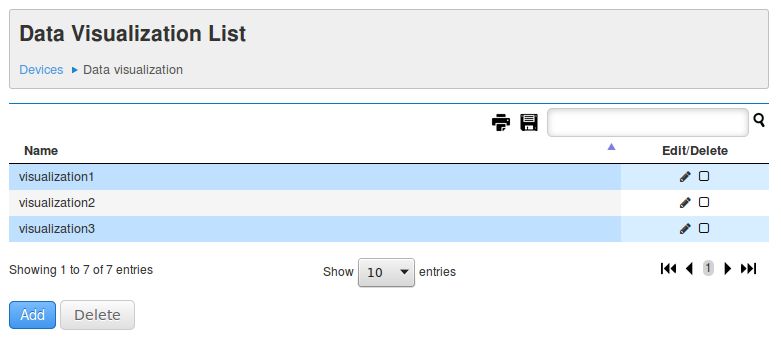
The List of data visualizations in the Devices → Data visualization menu shows all the visualization that belong to the customer. A system or administrator user can create a Data visualization by clicking on the Add button whilst he/she can edit it by clicking on the Edit icon in the data visualization row.
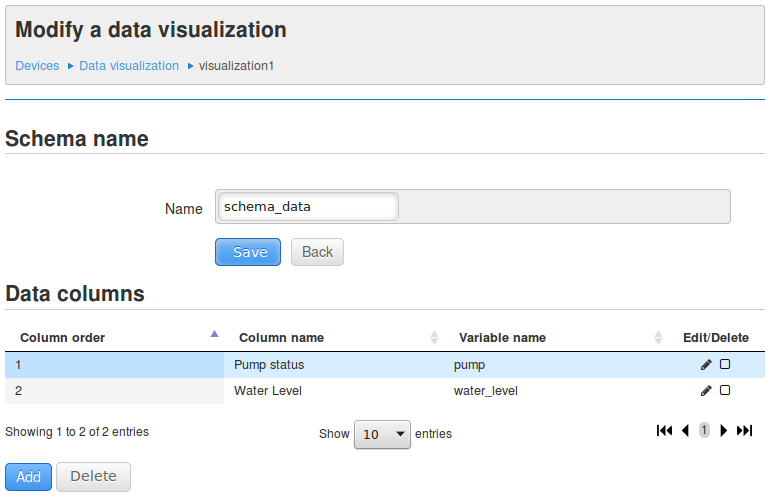
Each data visualization must have a name that identifies it. If the data visualization has already been created, under the Name field there will be a table, initially empty, that will contain all the visualization rules for each variable.
A system or administrator user can create or modify a Rule by clicking on the Add button whilst he/she can edit it by clicking on the Edit icon.
Both operations allow to set the following options:
Variable name - The variable name to which this rule will be applied.
Column name - The name of the column. In the user interface, the variable will be displayed with this name and not anymore with the name of the variable.
Column position - The position in which this column is displayed.
Type - There are three types of visualizations:
Default - Shows the raw number as it arrives from the device.
Decimals - The number of decimals to display in the raw number.
Eg. If the water_level is 5.78 and the decimals to use is 1, the displayed number will be 5.7
Hidden - Do not show this column.
This option is only valid for the table in the Data tab and is useful if the user do not want to display a variable that is sent by the device.
Boolean - Associate an icon or a string when the variable has a given value. It’s possible to set:
- When variable value is - The first value that the variable must have in order to apply this rule.
- Display - The string or icon to visualize when the variable’s value matches the first value.
- When variable value is - The second value that the variable must have in order to apply this rule.
- Display - The string or icon to visualize when the variable’s value matches the second value.
There is no limit in the number of data visualization that can be defined.
Only a system or administrator user can create or modify visualizations.
After a visualization is created, it may be associated to one or more devices. This operation takes place in Devices by clicking on the Modify button and selecting in the Data visualization field the dedired visualization.