4.2. Device configuration
Selecting Configuration, it’s possible to enter on the area dedicated to the DeepLog configuration.
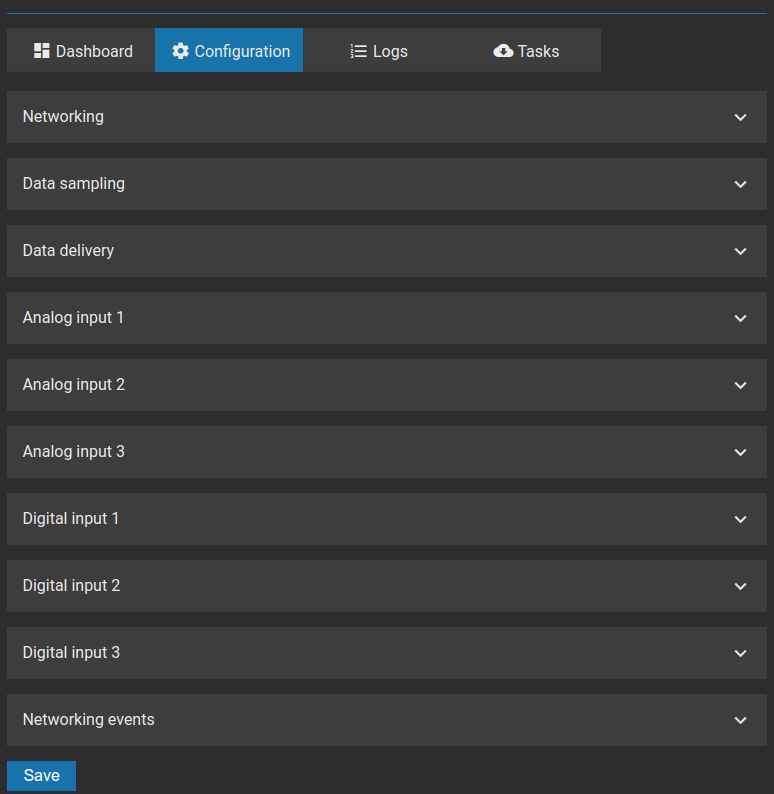
The configuration allows to set the following parameters:
- Networking
- Data sampling
- Data delivery
- Analog inputs
- Digital inputs
- Networking events
Warning
The modifications entered in this section are first saved by DeepLog Portal and then made available for the device. The modifications will be applied at the first connection of the device with the Portal (for example at the first data delivery scheduled)
4.2.1. Networking
Clicking on Networking, it’s displayed the area that allows to configure some of the main parameters useful for the proper functioning of the SIM data connection.
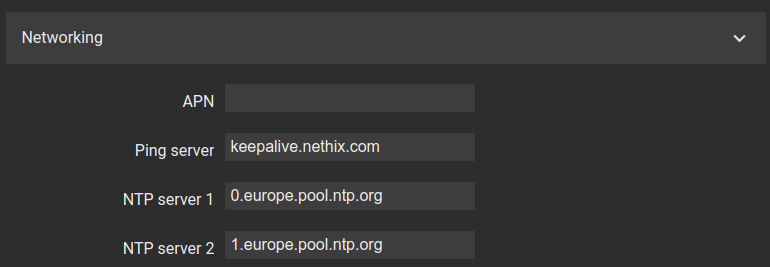
- APN The APN (Access Point Name) is an important option, to be configured for a proper functioning of the data connection. The value of this parameter may vary according to the Provider of the Sim card inserted in the device. For further information contact the Provider or visit its web site.
- Ping server It allows to configure the server, where the DeepLog regularly sends a ping. This allows to keep the internet connection of the device monitored. Unless otherwise required by the customer, it’s possible to keep the default settings (keepalive.nethix.com)
- NTP server 1 and 2 They allow to indicate up to 2 NTP servers. The NTP (Network Time Protocol) is a system, that provides the synchronization of data and time in the devices. Once established the data connection, DeepLog will get the correct data and time information from the server. Unless otherwise required by the customer, it’s possible to keep the default settings (0.europe.pool.ntp.org and 1.europe.pool.ntp.org)
4.2.2. Data sampling
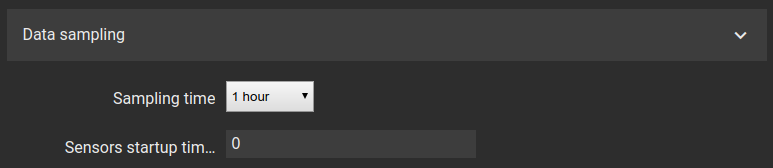
Clicking on Data Sampling, the section is entered, where the interval of time for the execution of the data sampling on the connected sensors is set.
The available options are:
- 1 minute
- 5 minutes
- 15 minutes
- 30 minutes
- 1 hour
- 3 hours
- 6 hours
- 12 hours
- 24 hours
It’s also possible to enter a value on the field Sensor startup time (seconds): this parameter defines, how long DeepLog should supply any active sensors (i.e. those sensors that require an external power supply).
Warning
The programmed frequency of DeepLog wakeups and the duration of sensors startups (beside the current consumption of the same) may influence the battery lifetime.
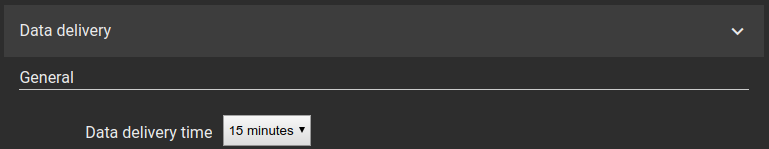
4.2.3. Data delivery
Once defined the data sampling time in the internal memory of the device, it’s possible to select the option Data delivery, in order to define the interval of time and the recipient of DeepLog data delivery.
The first parameter to be entered is the Data delivery time. This parameter is unique for any type of delivery and is strictly connected with the sampling time described above.
It’s in fact possible to program DeepLog with two different intervals of times for data sampling and data delivery.
For example, if we set a sampling time of one hour and a delivery time of 24 hours, DeepLog would be started up 24 times a day, but establish the data connection only once a day.
The available options are:
- 15 minutes
- 30 minutes
- 1 hour
- 6 hours
- 12 hours
- 24 hours
- 2 days
- 1 week
Warning
The frequency of the required data delivery of DeepLog influences the number of data connections and thus the battery lifetime.
There are three different data delivery methods, and they can be enabled simultaneously: HTTPS, FTP and Email.
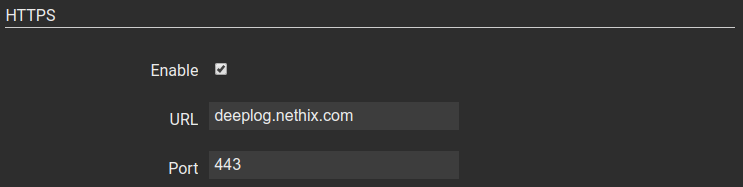
HTTPS
The HTTPS method allows DeepLog to send data to DeepLog Portal.
For a proper functioning of the system, keep the default parameters unchanged.
- URL deeplog.nethix.com
- Port 443
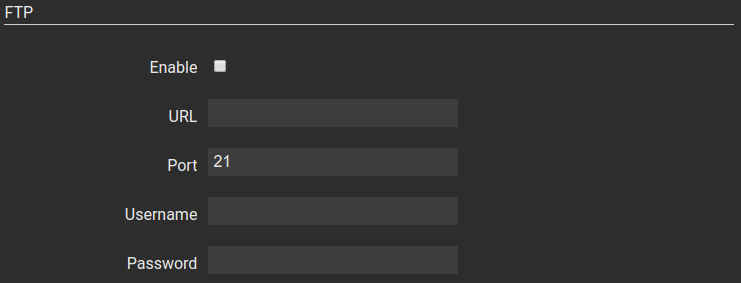
FTP
For this data delivery method, the customer must start up his own FTP server. In this case the data are delivered in .csv format, in order to be easily processed.
The required parameters are those normally requested in similar systems:
- URL FTP server address: where DeepLog shall deliver the data to
- Port Server port
- Username and Password Credentials for the authentication on the FTP server
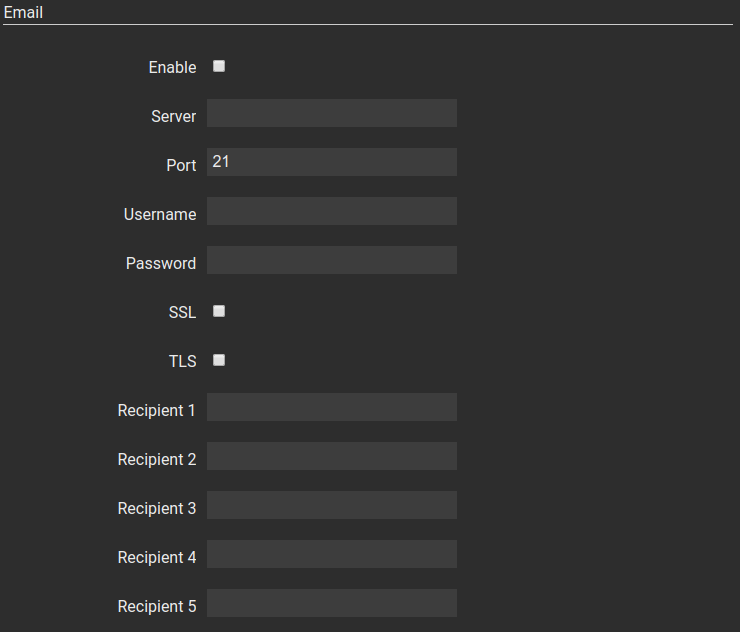
Email
Even for the Email data delivery, the customer has to provide the management of the delivered data. Also in this case the used format is the .csv..
- Server It specifies the used email server
- Port It indicates the Email server port to be used
- Username and Password Credentials for the email server
- SSL and TLS It allows to specify the encryption protocol, if required (even both)
- Recipient the fields Recipient 1..5 allow to enter up to 5 Email addresses for the data delivery
4.2.5. Digital Inputs configuration
DeepLog is equipped with 3 digital inputs, each of them configurable according to the specific requirements of the installation and of the sensors to be read.
To configure the digital inputs click on the option Digital Inputs 1,,3.
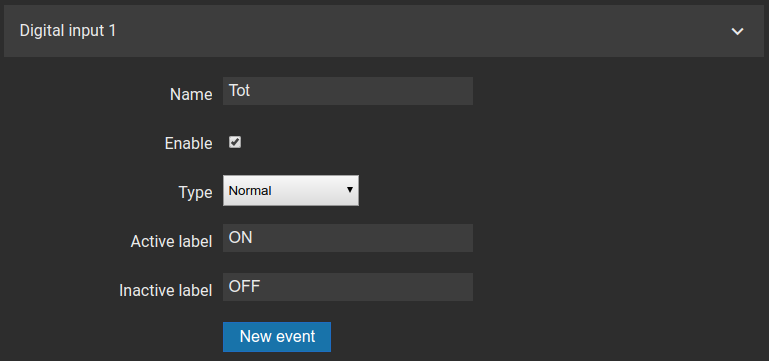
- Name The name to be assigned to the digital input
- Enable Check the box to enable the input
- Type It’s possible to choose the desired digital input type. According to the selection, the following fields may have different meaning. The available options are: Normal, Totalizer, Flowmeter and Power output.
NORMAL
Selecting this option, the input will be used for getting the status open/closed (for instance in case that a float is connected to the input)
- Active label In all the areas where the status of the inputs will be required (for instance on the received logs or on the dashboard) this description will be displayed, to indicate the status contact closed
- Inactive label In all the areas where the status of the inputs will be required ( for instance on the received logs or on the dashboard) this description will be displayed, to indicate the status contact open
TOTALIZER
Selecting this option, the input will be used as a totalizer. At each received impulse, the value of the totalizer will increase of the quantity specified by the user.
- Unit It allows to enter the measurement unit for the parameter to be acquired
- Volume It represents the incremental value for each received impulse
- Decimals It allows to specify the number of decimals to be displayed
Hint
DeepLog can read the impulse received on a digital input configured as a Totalizer, even if it’s on energy saving status.
Warning
Totalizer option is available only for the digital inputs 1 and 2.
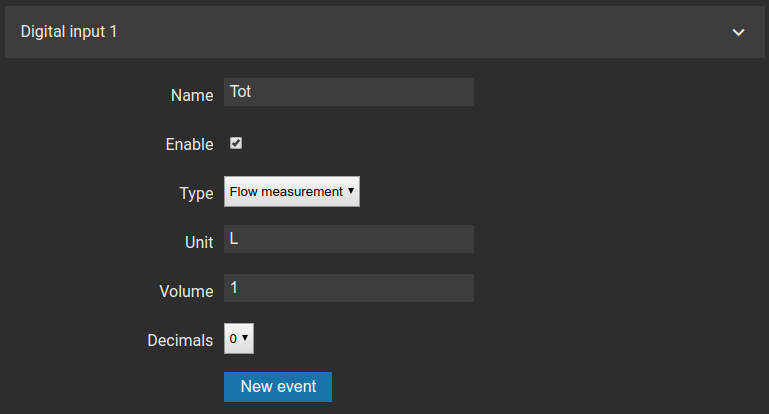
FLOWMETER
Selecting this option the input will be used as a flowmeter. The sample unit set by the user will be then divide for the time calculated between two impulses.
- Unit It allows to enter the measurement unit for the parameter to be acquired
- Volume It’s the sample unit to be divided for the time passed between two impulses.
- Decimals It allows to specify the number of decimals to be displayed.
Example:
- Unit: l/s
- Volume: 100
- Data sampling: every 30 minutes
- Data delivery time: every hour
Even if in energy saving status, DeepLog counts the number of received impulses.
Every 30 minutes the device wakes up and save in the internal memory the number of impulses received. Then it resets the counter and starts counting again.
Every hour it sends two types of data to the DeepLog Portal: each of them includes the result of 30 minutes sampling. DeepLog Portal calculates the flow, multiplying the volume by the number of impulses and dividing the result for the sampling time.
Hint
DeepLog can read the impulses received on a digital input, configured as Flowmeter, even if it’s in energy saving modality.
Warning
Flowmeter option is available only for the digital inputs 1 and 2.
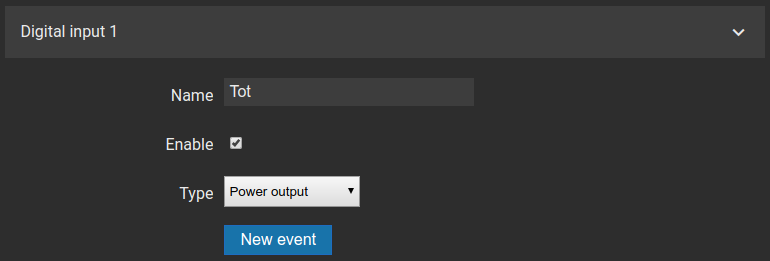
POWER OUTPUT
Selecting this option the input will be used for powering active sensors, that require an external power supply.
The so configured digital input cannot be used for reading impulse.
The status of the input will be described as OK if no anomalies are detected and as Overcurrent if the device detects a current request higher than the max. allowed.
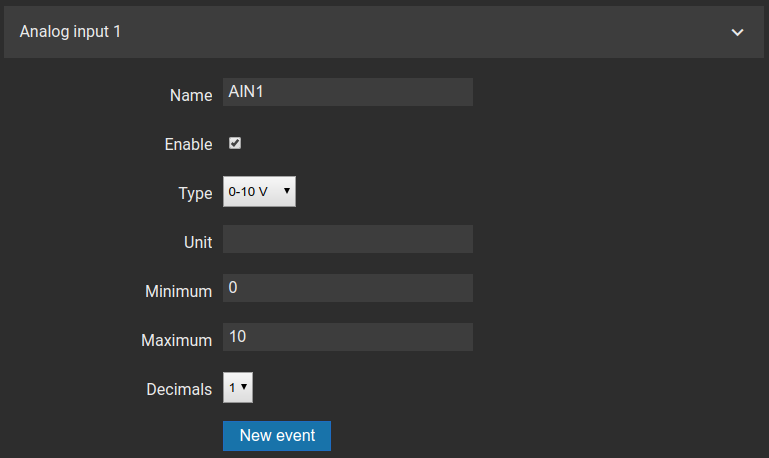
Independently from the selection made on the field Type, once filled in the specific parameters, it’s possible to click on New Event, and visualize the area dedicated to the event creation.
The creation of a new event allows to define a condition that, at its occurrence, lets DeepLog Portal send an email to one or more recipients, for instance, at the crossing of a certain alarm threshold by one of the monitored sensors.
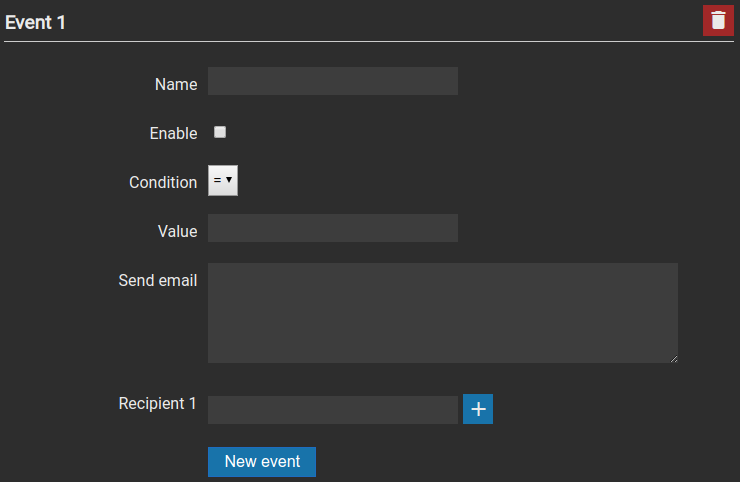
- Name Name to be assigned to the event being created
- Enable Check the box to enable the event
- Condition Specify the condition that shall occur for triggering the email to the recipients. The available conditions are: equal to, different from, lower than, lower or equal to, higher than, higher or equal to.
- Value Enter the value of the threshold, for the triggering of the event
- Send email Enter the text of the email to be sent
- Recipient Enter a valid address for the recipient of the email. Through the icon
 can be added further recipients. To remove a recipient from the list, click on the icon
  available on the right top corner
Example:
- Analog Input: Analog Input 1
- Condition: higher than
- Value: 5
The email will be sent when the value of the Analog Input 1 is higher than 5.
Warning
The events are managed by the DeepLog Portal and not by the device. The condition is in fact applied on the already received data and not on those yet to be delivered.
The emails are sent by the DeepLog Portal through a default email address (that cannot be changed by the user).
The timeliness in the alarm notifications depends on the frequency of the configured data delivery, as described on paragraph 4.2.3
After the configuration of an event, it’s possible to create a new one clicking on New Event. To cancel a previously created event, click on the icon .
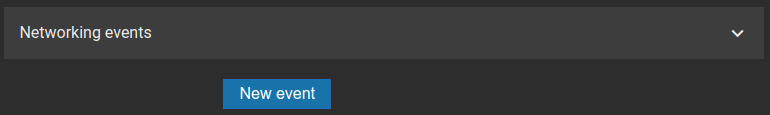
4.2.6. Networking events configuration
Selecting the option Networking events from the page Configuration, it’s possible to add events, in order to send email notifications in case of malfunctions: for example if a DeepLog misses the scheduled data delivery.
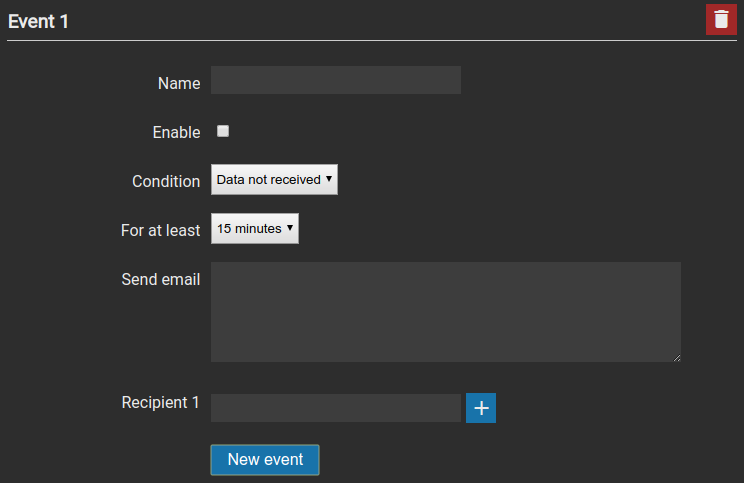
To add a new event, click on New Event
- Name The name to be assigned to the digital input
- Enable Check the box to enable the input
- Condition Describe the condition that must occur, for triggering the email notification to the recipients. The available conditions are: data not received
- For at least Enter the time for keeping the condition activated before sending the email notification
- Send email Enter the text of the email to be sent
- Recipient Enter a valid address for the recipient of the email. Through the icon can be added further recipients. To remove a recipient from the list, click on the icon available on the right top corner
After the configuration of an event, it’s possible to create a new one, clicking on New Event. To cancel a previously created event click the icon .
4.3. Received data visualization
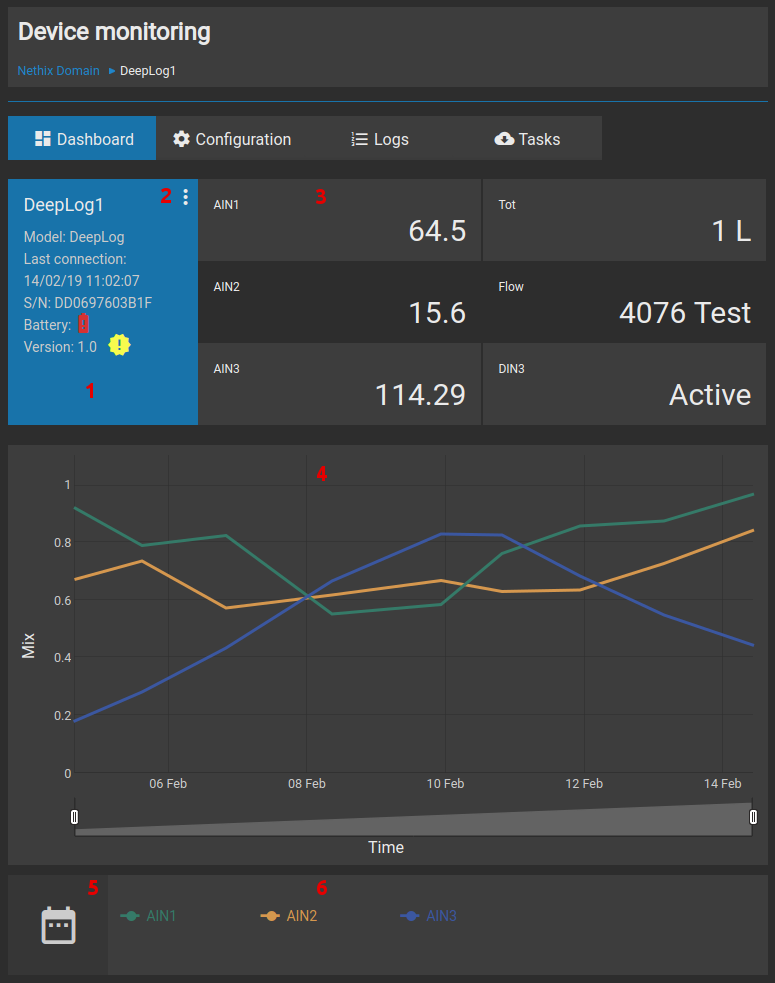
Selecting one DeepLog from the list of available devices, it’s possible to display the chart of the collected data on the page Dashboard. Selecting the page Log, it’s possible to visualize the data on tabular format.
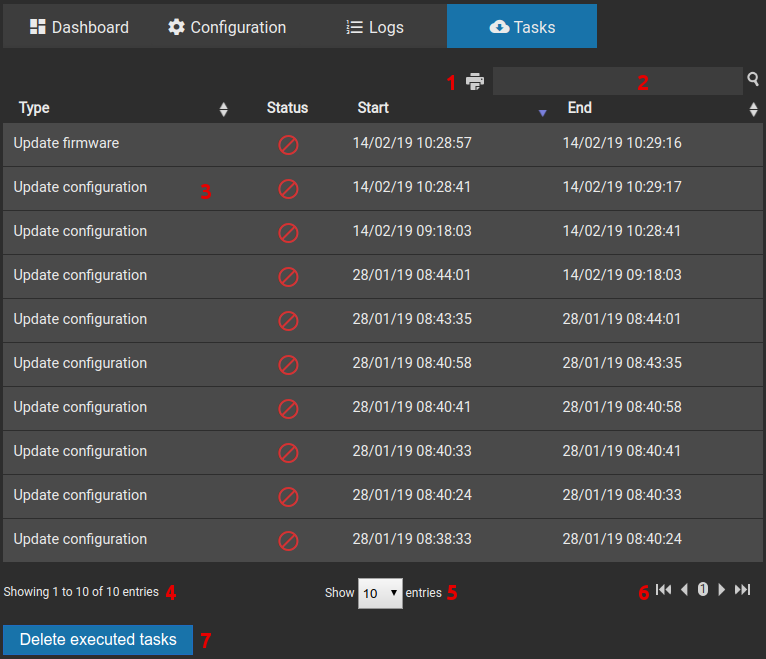
The Log section is divided into two areas: the upper part (called Data) reports all data referred to the analog and digital inputs, while the lower part (called Events) shows the complete list of occurred events ( both referred to threshold crossing and to connectivity issues).
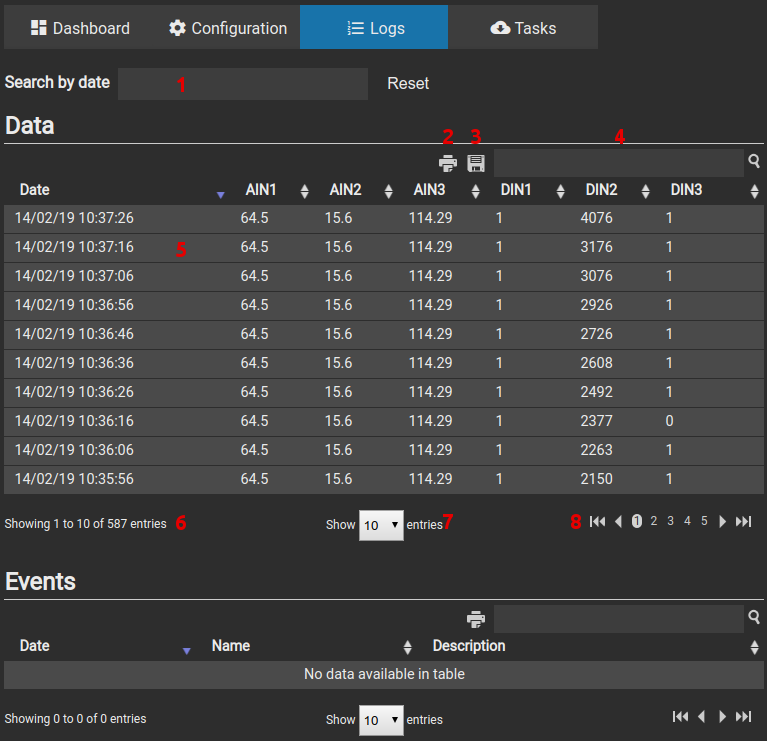
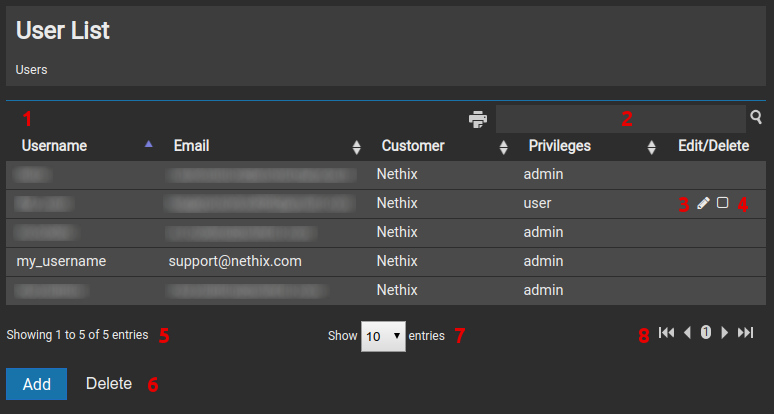
- 1 Clicking on “Search by date” the calendar opens, and gives the opportunity to select the desired time interval
- 2 Clicking on this icon it’s possible to print the currently displayed data
- 3 Clicking on this icon it’s possible to export the data, in order to save them in the PC. The file is in .csv format
- 4 In this tab it’s possible to enter a specific value to be searched among all available data
- 5 Here are displayed the logs available within the defined time interval. On the first left column is the real date and time of the logs (not the date and time of the log delivery to the Deeplog Portal), the following columns show the data referred to the sampled inputs
- 6 This allows to know the totality of the registered log
- 7 It allows to select the quantity of logs to be displayed on this page: 10, 25, 50 and 100
- 8 These keys allow to browse through all the pages of the menu
Hint
The displayed data on this page are not the raw data collected by the device, but are already scaled according to the settings made by the user.
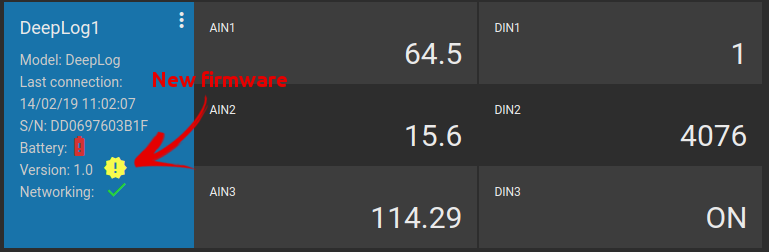
4.5. Firmware upgrade
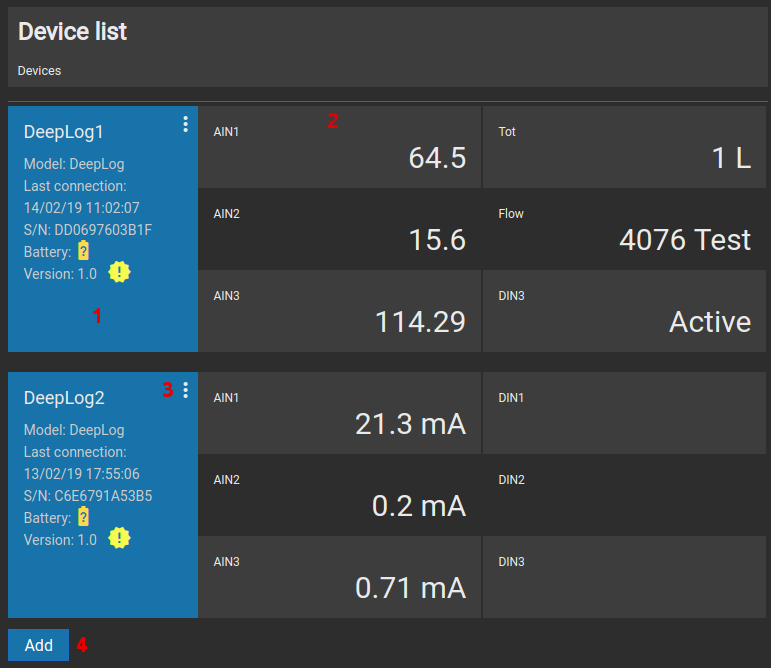
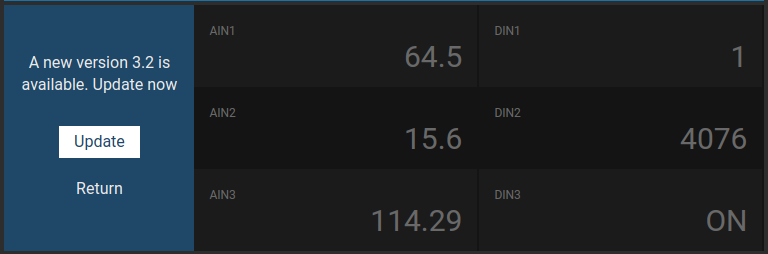
DeepLog Portal allows to remotely upgrade the managed devices. The availability of a new upgrade is notified through a dedicated icon, available on the summary box of each Deeplog (both from the Device List and from the Dashboard).
Clicking on the icon  it’s possible to start up the upgrade procedure. It’s then required to confirm the operation, clicking on the button Update or to quit clicking on Return.
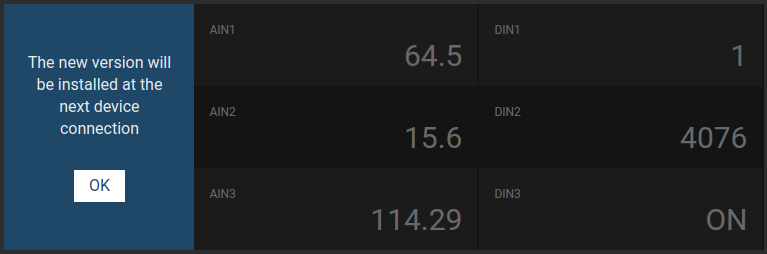
Confirming the Update, the following page will appear
Clicking now on OK, a new task is created and the icon  appears. The task will be executed at the first connection of DeepLog to the DeepLog Portal