If allowed by the type of register/variable, TP100 enables access to the Preset mode, where you can modify the read value and set it in the connected Modbus device.
To enter Preset mode, touch and hold a tile.
4.1. Setting the Value of a Register
Once in Preset mode, if the register allows, it will be possible to modify and set a new value.
For this to happen, the following must be taken into account:
- The Read Only option must not have been activated during configuration
- A valid Modbus write command must have been associated with the register during configuration
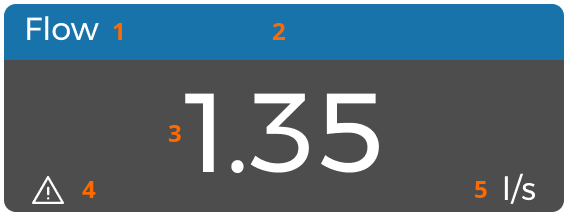
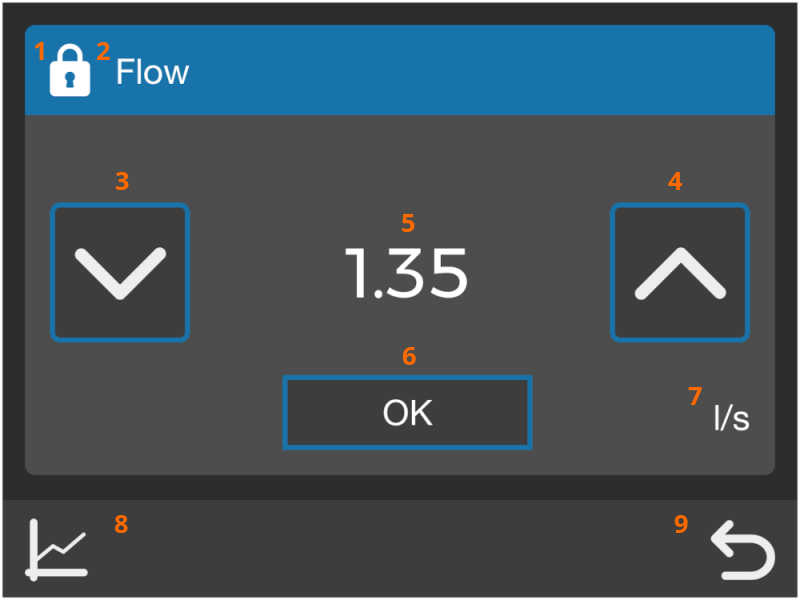
In this case, arrows will appear next to the current register value, allowing you to increment ( ) and decrement (
 ) the register value.
There are two ways to use the arrows:
In the first case, the rightmost digit, whether integer or decimal, will be incremented/decremented from the current value.
Holding an arrow for at least 3 seconds (long touch), the increment/decrement step will switch to the second digit from the right.
Continuing to hold the arrow for other 3 seconds it will step to one position further, modifying the third digit from the right, and so on.
Releasing the button and pressing it again with a short touch will apply the increment/decrement to the rightmost digit.
EXAMPLE
- Starting value: 10.1
- Applying a short touch on the up arrow will increment the decimal digit
- Holding it for 3 seconds will start to increment the units
- Holding it for 6 seconds will start to increment the tens
Once the desired value is selected, it will be possible to confirm the change by pressing the  button.
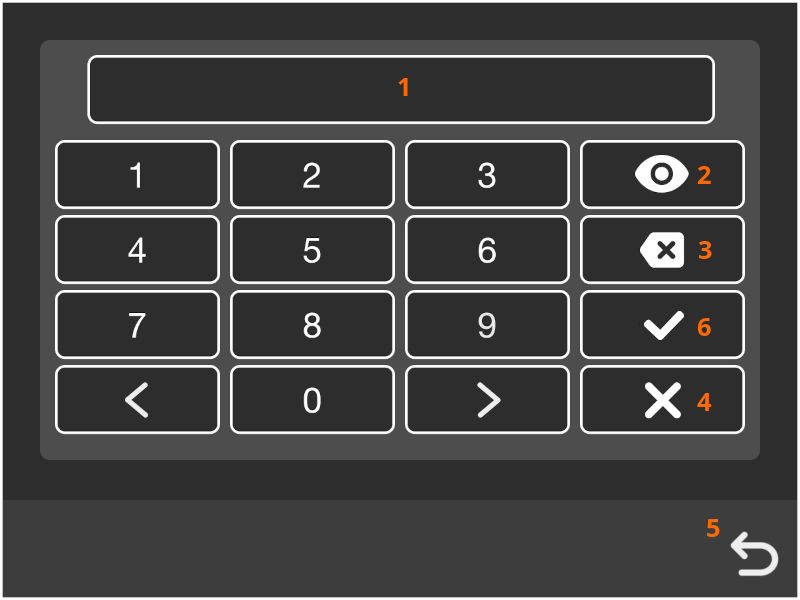
If the register is protected, the password entry screen will appear:
In addition to the numeric keypad for entering the password, the following elements are present:
- 1 Area where the numeric code will be entered. It will be highlighted in red if the entered code is incorrect.
- 2 Touch this icon to view the entered code.
- 3 Touch this icon to delete the last entered digit.
- 4 Touch this icon to cancel the code entry and return to the Preset screen.
- 5 This icon allows canceling the entry and returning directly to the Home screen.
- 6 Appears only after entering at least 3 digits (minimum password length) and allows confirming the entered code.
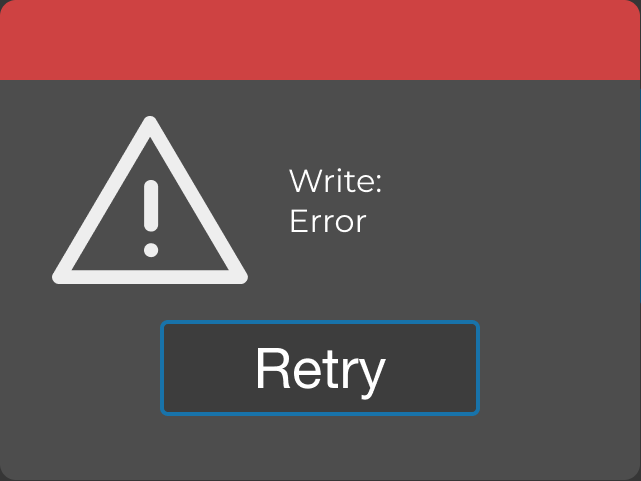
Regardless of whether a numeric password entry is required, after confirming the value change TP100 will attempt to send the Modbus command to the connected device.
A pop-up with Write: Waiting will appear. If the operation is successful, the pop-up will disappear, and the Preset screen will be displayed again, showing the new value.
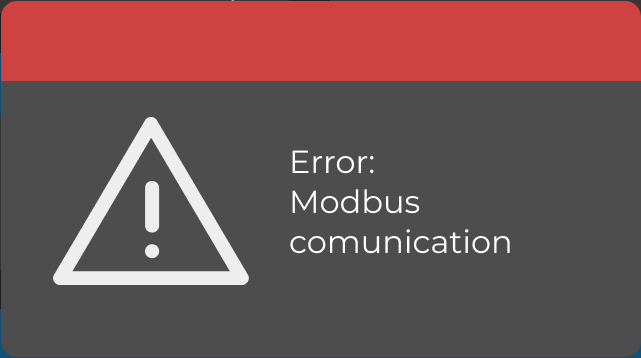
Otherwise, a pop-up with Write: Error will appear, and it will be possible to retry by pressing Retry.
If the issue persists, it is advisable to check the device configuration.
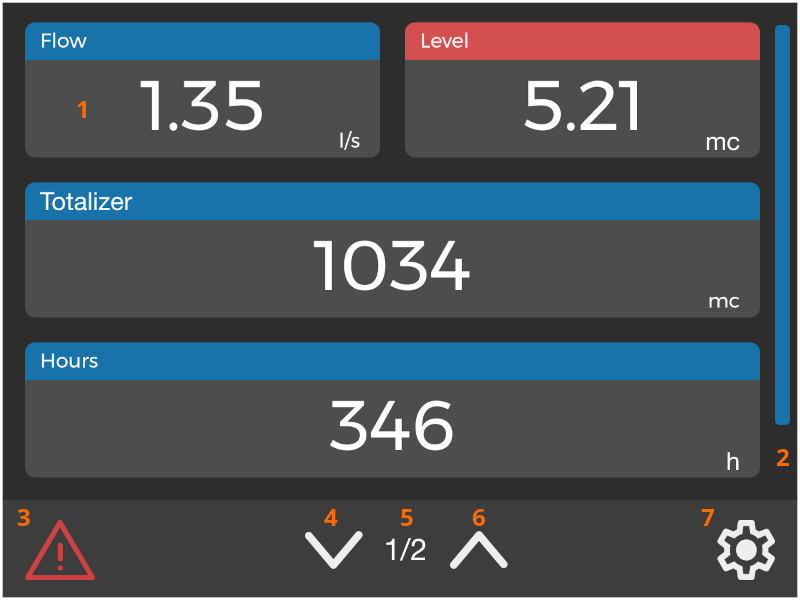
4.2. Real-time Graph
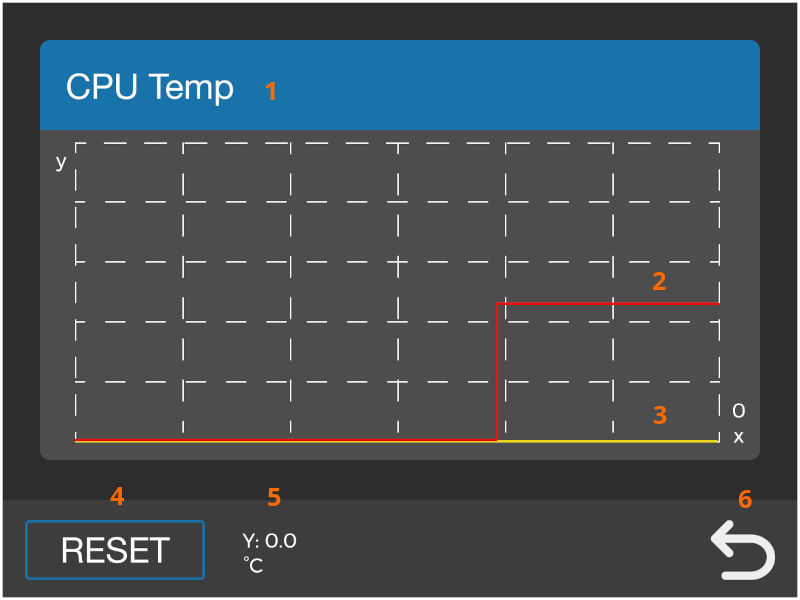
TP100 also allows viewing a real-time graph of the read values to verify the trend of the measured variable.
Once in Preset mode, simply select the  icon. Below is a description of the elements that make up the screen:
- 1 Name assigned to the register during configuration.
- 2 The red trace represents the current value, starting from the right edge.
- 3 The yellow trace represents zero. Useful especially for variables that oscillate between negative and positive values.
- 4 The Reset button allows clearing the graph area and restarting the acquisition.
- 5 This area displays the current value (and unit of measure) in figures.
- 6 Touching the Back button returns to the Preset screen.
Below are the main features of the graph:
- The graph starts generating when the screen is displayed. The displayed data is acquired in real time by TP100, and once the screen is closed, it will not be possible to view it again.
- The graph generation starts from right to left, adding a point every second, up to a maximum of 100 points/seconds.
- Autoscale is also present on the ordinate (y) axis, calculated based on the maximum value among the displayed points.
To view the register value in figures at a given moment, it is possible to touch any point in the graph area.
A vertical cursor (dashed blue line)will be added, attached to the trace representing the current value.
This cursor allows viewing the register value at that moment in the dedicated area (point 5).
The cursor will maintain its position on the x-axis even for subsequent points, updating the reported value in the dedicated area with each new received point.
Note
Due to limited space/resolution availability, some value variations may not be evident in the graph.
For example, in the case of variables whose value extends in the order of tens/hundreds, variations related to the decimal part may not result in a visual change in the trend.